At one of my previous assignments, we had an environment where we were running our microservices on Azure AKS clusters and were connecting to Kafka clusters in Confluent Cloud. For our monitoring and logging, we were using Datadog. Datadog has an integration with Confluent, but that is not for the Confluent Cloud platform. Since we had all of our dashboards in Datadog we really liked to have the Confluent Cloud metrics in Datadog as well. With this blog post, I will show you how to get this done when you have a similar setup.
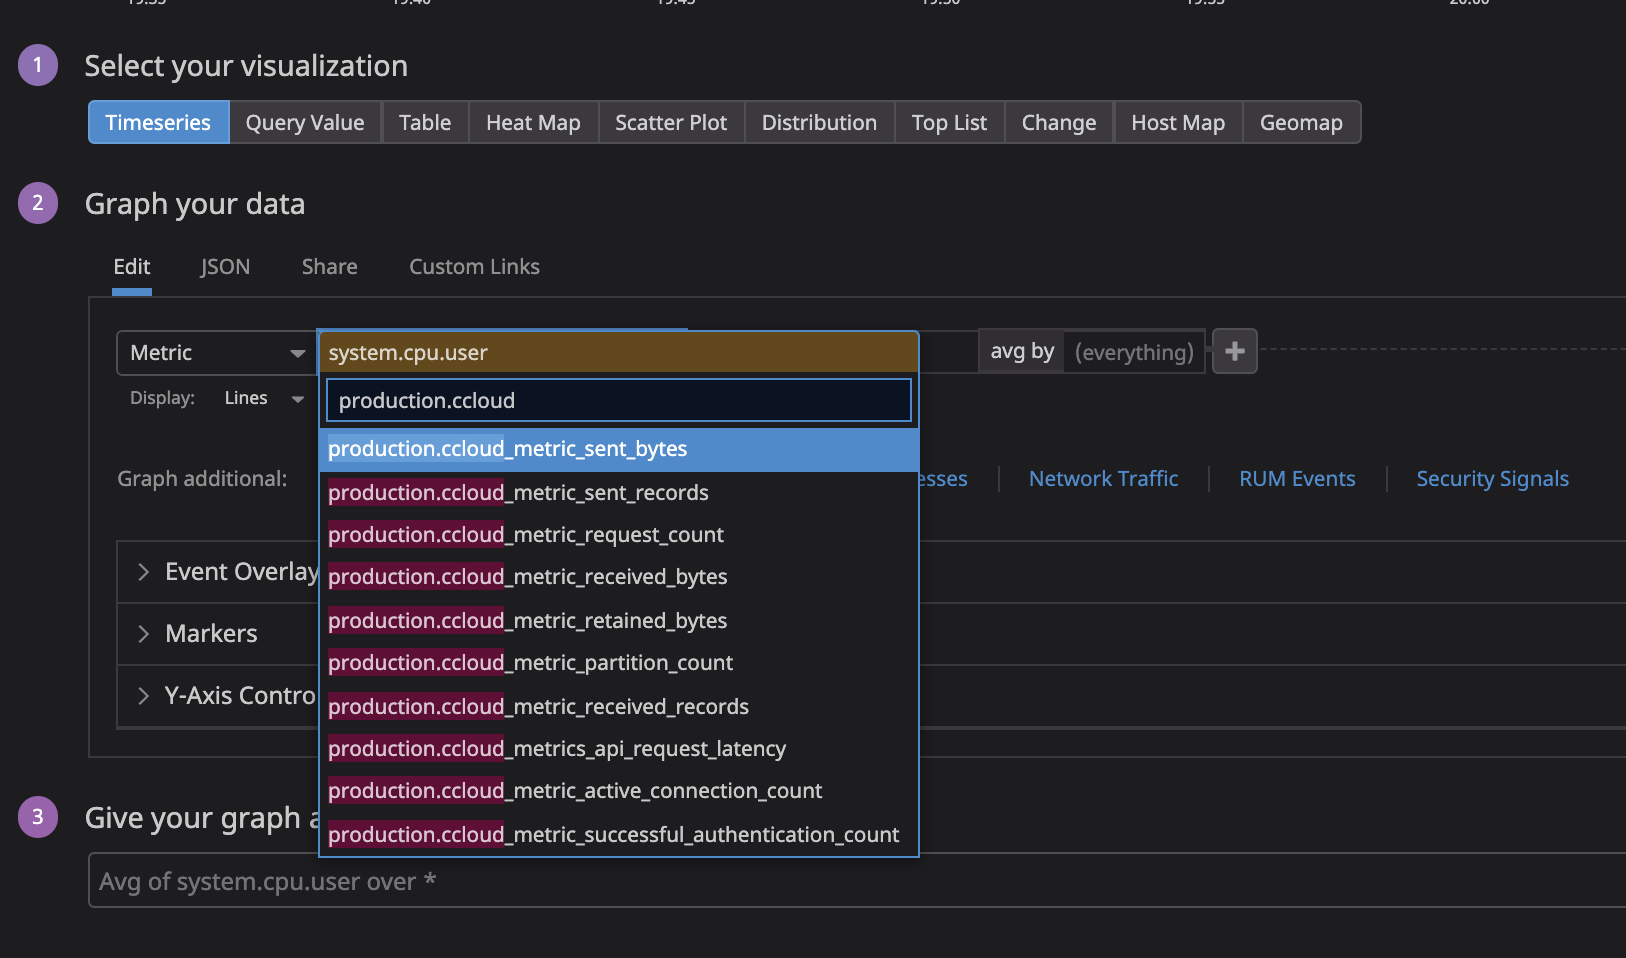
After a bit of searching, I found a Prometheus exporter for extracting metrics from the Confluent Cloud Metrics API. All I needed to do was set up this exporter in combination with the Datadog agent, so I could send those metrics to Datadog. As we were running everything on k8s I also wanted to run this exporter on our clusters as well. On my github you can find the manifest which creates a deployment with a ReplicaSet of one and has two containers, namely the ccloud exporter and the datadog agent. Once deployed it will start fetching metrics and exporting it to Datadog.

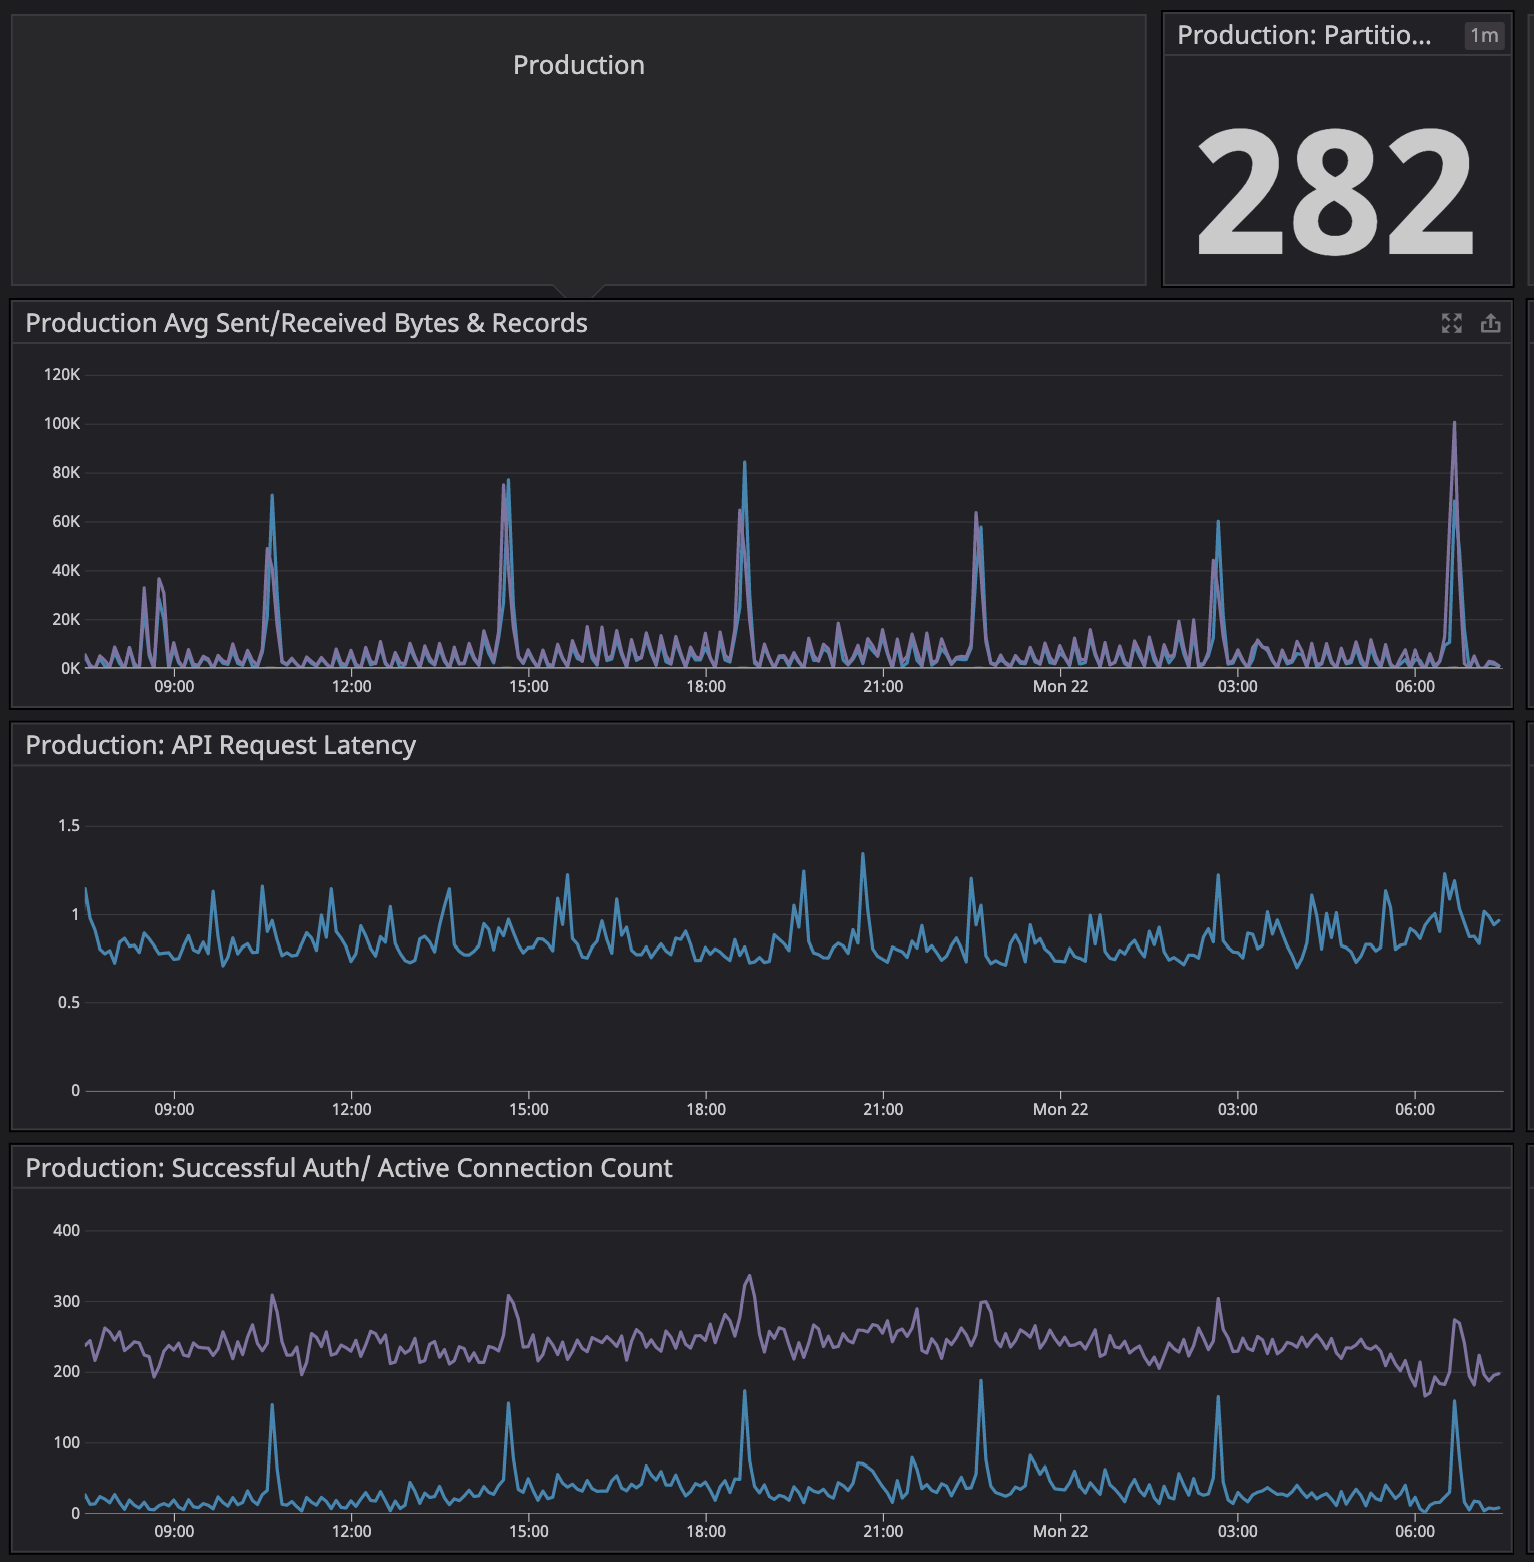
If you need some help with creating dashboards you can check the Datadog documentation here. Once you have set up the widget with the metrics you like, you will get something like the dashboard below.
If you have any questions then you can leave a comment or contact Bram via Github, Linkedin, or Twitter.
Originally published on Bram’s blog.


